
In part one of this series, we built a long list of candidate markets and scored each one for attractiveness against economy, culture, institutions, and market access. That scoring exercise is genuinely useful, but on its own it can only tell you which markets look promising in principle. It can’t yet tell you whether the opportunity in any one of them is big enough to justify the investment of entering.
Deciding which international market to enter is as much about the size of the prize as it is about how welcoming a market feels, and this is the stage where a lot of founders either talk themselves into a market that was never going to move the needle, or walk away from one that would have paid off handsomely, simply because they never put a credible number on it and weighed things up objectively.
Table of Contents
Deciding which international market to enter means looking past a green scorecard
A market can score green across the board on institutions, culture and economy, and still be the wrong choice if the realistic opportunity within it is small relative to what you’d need to invest to enter properly. Equally, a market with a more mixed scorecard can be worth the extra effort if the underlying opportunity is large enough to absorb the friction. Attractiveness and size answer different questions, and you need both before you’re making a genuinely informed call rather than a hopeful one.
This is where most of the market evaluation strategies I see founders reach for start to wobble, because sizing a physical product opportunity properly takes a different kind of research to sizing a software or services market. There’s no LinkedIn search that tells you how many people in Jakarta are buying premium chocolate chip cookies, and no keyword traffic report that substitutes for actual import volumes. You need data that reflects how physical goods actually move into and around a market and whilst that sounds obvious, it’s not so easy to get your hands on reliable numbers.
Building your funnel: TAM, SAM, and your realistic share
The starting point is what’s generally called your total addressable market, or TAM: the broadest, highest-level estimate of demand for your category in that country. From there, you narrow down to your segmented addressable market, or SAM, which is the portion of that total you could realistically serve given your specific product, price point, and positioning. Finally, you land on a realistic percentage of that SAM you could credibly capture within a sensible timeframe, given your resources and route to market.
Each layer of that funnel should be smaller and more grounded than the one above it. A common mistake is treating the TAM as though it were the opportunity itself, when in reality it’s simply the outer boundary of what’s theoretically possible before you’ve applied any of your own constraints to it. This funnel is the practical engine room of deciding which international market to enter, since it’s what turns a promising-looking country into an actual, defensible business case.
Let’s say you had a high protein organic biscuit (cookie) that you want to sell into Italy, and you know that the biscuit market in Italy is worth X (= 100% of the market). Only a smaller percentage of consumers will have an interest in either a high protein or an organic biscuit brand, and only a smaller % of those will be interested in a brand that offers both. So your segmented addressable market could be potentially just a few % of the TAM.
With premium products, you automatically have a segmentation according to price for example. When the brand Mercedes expanded into a developing market for the first time they knew that not every consumer who was looking to buy a car would be able or willing to afford a Mercedes, but the SAM was still lucrative enough to make the step worthwhile.
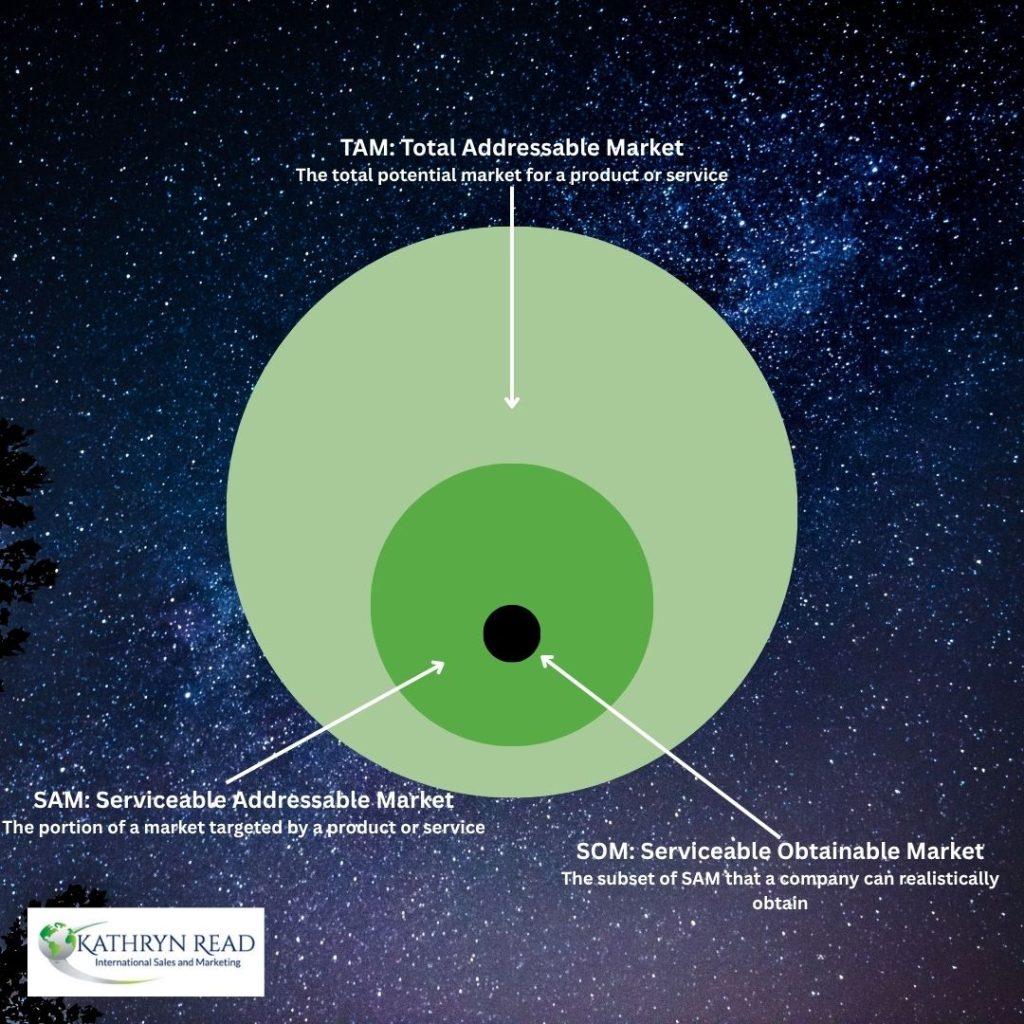
Steps for assessing market potential overseas when selling physical goods
For food, beverage and mum and baby brands, the sourcing logic looks quite different to a services or software business, and it’s worth being deliberate about where you look:
Retail audit and market research data.
Companies like Nielsen and Euromonitor publish category-level reports covering market size, growth rates and channel splits in many countries. These are extremely expensive if you want to buy the most up to date info with allllllll the details they offer and for a niche category they may be simply unavailable, but where they exist, they’re a strong starting point for your TAM.
Without wishing to sound negative, I’d say you have to bring a healthy dose of scepticism to the table when analysing this kind of numerical data – who was it collected for (there’s normally a main company commissioning (paying) for the data, and the category definitions may be made according to their portfolio. Also, you have to check HOW the data is collected. In much of Western Europe Nielsen buys scanner data from the main supermarkets, but in markets such as South East Asia, the information may be calculated on the basis of shopper surveys outside supermarkets in major cities and then extrapolated across the whole country.
Analysing this kind of data should be science but is actually often more like a kind of black art where you are trying to “square the circle” of 3 different sources giving you opinions about the TAM.
Government trade offices and commercial attachés
Many countries maintain commercial sections within their embassies specifically to support exporters, and they often hold sector reports or can point you towards local data you wouldn’t find otherwise. This is a frequently underused resource, and it’s usually free or at least affordable.
I’m a big fan of working with your commercial section if possible, just bear in mind that the quality varies according to the staff and according to whether the diplomatic function or supporting businesses is their main focus.
Import and export statistics.
Trade data broken down by HS code, the harmonised system codes used internationally to classify traded goods, can show you actual historical import volumes for your product category into a given market. This tells you what’s genuinely moving through customs today, which is a far more reliable indicator than a general market size figure. Obviously official import figures don’t give you an overview of the domestic production levels – just bear that in mind if your SAM includes domestic producers too.
A platform such as Volza (affiliate link) can be a big help here.
Distributor and trade conversations.
This is where my own bias as a distributor management specialist shows, but it genuinely can be one of the most valuable sources available to you. A conversation with a potential distributor, even before you’ve formally engaged them, will often surface real sell-in and sell-through figures for comparable products, along with a far more honest read on pricing headroom than any desk research will give you.
The only caveat would be that of course a distributor has their own agenda, so you have to always pass everything through a filter of caution to consider whether they are telling you the full story or only the numbers that fit their narrative.
Point-of-sale and shelf presence.
Where you can get it, either through a local partner or a research firm, actual retail scan data or a simple shelf audit tells you what’s really selling, at what price, and against which competitors.
And of course, you can visit and stand in front of a shelf yourself.
A worked example, continued
Picking up the beverage brand from part one, comparing Indonesia, the Philippines and a mid-sized European market: suppose Euromonitor category reports put the addressable beverage category in Indonesia at a meaningful multiple of the Philippines figure, largely down to population and rising urban disposable income. That’s your TAM for each market. Import statistics might then show that within that category, imported premium beverages currently make up a fairly small slice of overall volume in Indonesia, which becomes the basis for a more realistic SAM once you’ve applied your own positioning as a premium, imported product.
From there, a conversation with two or three potential distributors in each market, about the volumes they currently move for comparable brands, gives you a genuinely grounded sense of what a realistic first-year or second-year share might look like, rather than an arbitrary percentage plucked out of the air because it looked achievable on a spreadsheet.
Common mistakes when sizing the opportunity
Treating TAM as your forecast. The total market size is not what you’ll sell. It’s the ceiling, not the target, and presenting it as though it were your revenue projection is one of the fastest ways to lose credibility with a board or investor who’s seen this mistake before.
Skipping distributor conversations because they feel premature. Founders often want to have their numbers fully worked out before they speak to a potential partner, but a good distributor conversation is itself a source of data, not just a step that happens after the analysis is complete.
Ignoring the cost of getting the data. Some of the richest sources, formal industry reports in particular, can be expensive relative to what a small or medium business can justify spending at this stage. Be realistic about your budget for research itself, and lean more heavily on the free or low-cost sources, government trade offices and direct trade conversations especially, where the paid options aren’t proportionate to the decision.
Forgetting that this, too, needs revisiting. Market size isn’t static. A category that looked modest two years ago can shift substantially with a change in consumer habits or a new trade agreement, so treat this sizing work as something to update periodically, not a figure you calculate once and rely on indefinitely.
Where this leaves you when assessing market potential overseas
By this point, you should have a genuinely credible view of the size of the prize in each of your candidate markets, built from real trade and retail data rather than assumption. That’s the essence of deciding which international market to enter well: stacking evidence at every stage so the final choice is defensible, not just appealing. That’s a considerably stronger position than most founders are in when they make this decision, and it’s a key part of the broader factors influencing market selection that separate a considered expansion from an expensive guess.
It’s easy to get pushed into an overly theoretical calculation of what’s possible based on wishful thinking, so ask yourself critically at each stage if the numbers seems realistic to you. It’s REALLY hard to make a good estimate of what really is your SAM in a market where the numerical data is only partially available.
What it still doesn’t tell you is whether you, specifically, have the resources, team and product fit to go after that opportunity well. That’s the final piece of the puzzle, and it’s what part three of this series covers: assessing your ability to execute, understanding the competitive landscape you’d be entering, and pulling all three stages together into an actual plan.
If you’d like help applying these market entry evaluation criteria to your own shortlist, a 30-minute International Clarity Call is a good place to start.
Thinking that working with a consultant would accelerate your international expansion?
If you’d like to learn more about working with me for support on your internationalisation projects or personal export knowledge, you can book a 30 minute international clarity call here.
If you haven’t already signed up for my free e-book about how to select which international market to enter next, you can do so here, or using the form below.
If you enjoyed this content please share it on social media or recommend it to your network.
Pin this post for later!
If you are interested in working with distribution partners in your export markets, you might find these posts also interesting:
- Define Your Ideal Distributor Company Profile to Succeed Internationally
- Carrying out an Annual Distributor Performance Review
- Are you a great supplier?
- Factors to Consider when Deciding on Payment Terms
- Advantages of Working with a Distributor in Export Markets
- Making the Best First Impression in International Business Meetings
- Finding the Perfect Partner: Distributor Dating in a Hybrid World
- Store Checks in International Sales: a Retail Audit Example
- How to Make an Export Plan Part 1
- How to Make an Export Plan Part 2
- Starting to Think About Your International Distribution Agreement
- An International Distribution Agreement Checklist Part 1
- A Distributor Contracts Checklist Part 2
- The Legal Requirements in an International Contract 3
- Types of International Distribution Channels
- International After Sales Service
- 55+ Questions to Ask When You’re Looking for International Distributors
- International Customer Service in Korea: Dealing with Media Crises
- Why an Integrated Business Planning Framework could Improve your Exports
- Export Pricing Strategy in International Trade as a Key Factor of Product Market Fit
- Why and How should you Enhance Distributor Loyalty in Export Markets?

Kathryn firmly believes that business is done between people, and therefore places her focus on building strong relationships that form a solid foundation for doing business.
When she's not travelling around the world, Kathryn enjoys playing clarinet in her town's wind orchestra or sharing her love of the outdoors with her Scout group.